| |
 |
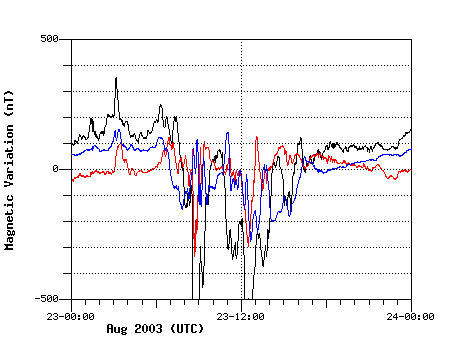
Magnetometer graph shows that since the first week of August there has been a definite eastward trend as shown by the upward curve of the red line.
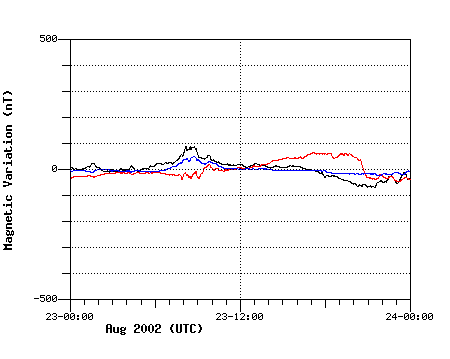
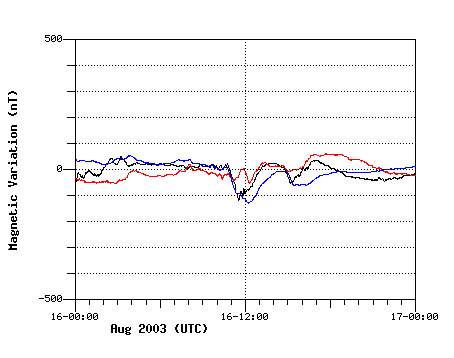
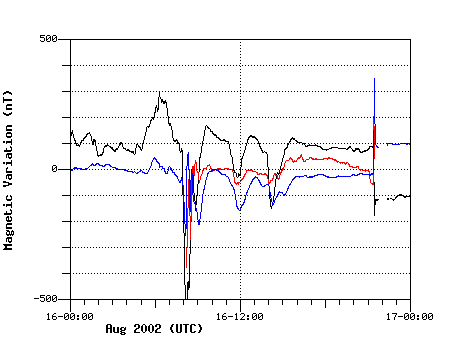
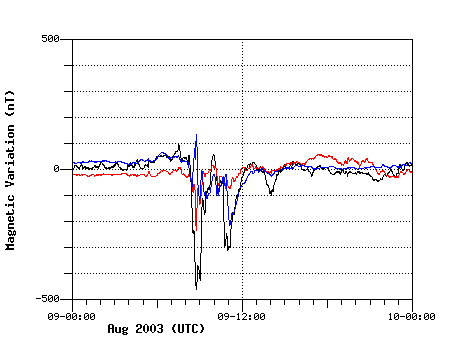
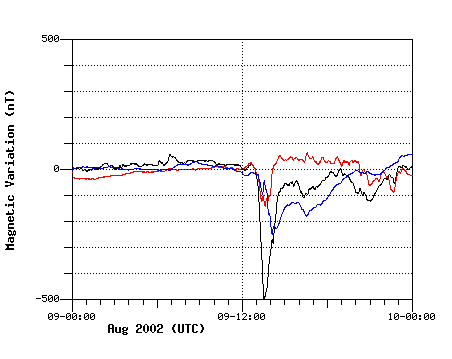
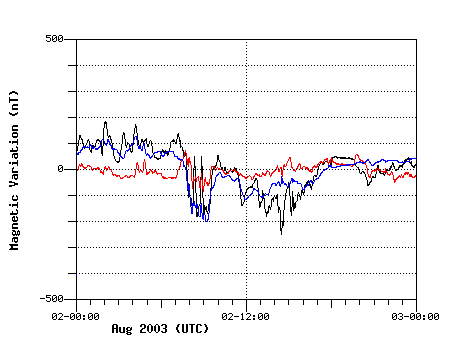
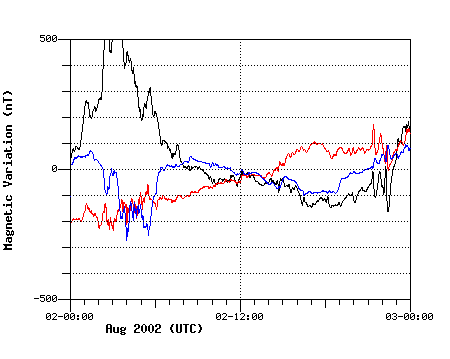
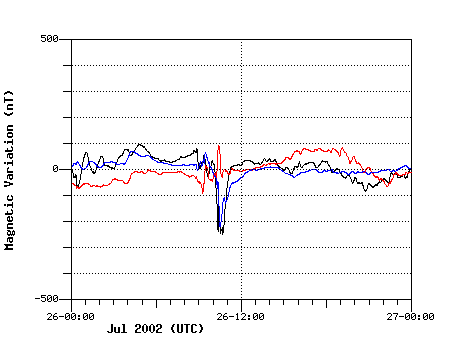
Below are 24 hour period charts stepping back through the weeks from August 23, 16, 9, 2, and July 26, with comparison charts for these dates from 2002. Note that the red line if more often above the zero mark between 00:00 UTC and 12:00 UTC in 2003 compared to 2002. This confirms some of the observations by individuals on compass variations.
